 扫码关注
扫码关注


数据分析师日常工作会涉及各种任务,比如数据预处理、数据分析、机器学习模型创建、模型部署。
在本文中,我将分享10个 Python 操作,它们可覆盖90%的数据分析问题。有所收获点赞、收藏、关注。
1、阅读数据集
阅读数据是数据分析的组成部分,了解如何从不同的文件格式读取数据是数据分析师的第一步。下面是如何使用 pandas 读取包含 Covid-19 数据的 csv 文件的示例。
import pandas as pd
# reading the countries_data file along with the location within read_csv function.
countries_df = pd.read_csv('C:/Users/anmol/Desktop/Courses/Python for Data Science/Code/countries_data.csv')
# showing the first 5 rows of the dataframe
countries_df.head()
以下是 countries_df.head() 的输出,我们可以使用它查看数据框的前 5 行: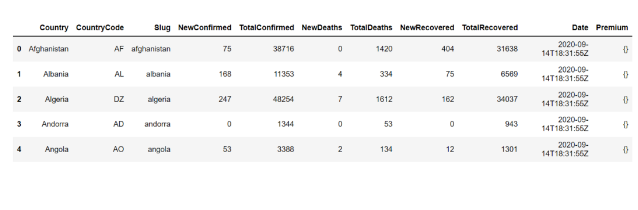
2、汇总统计
下一步就是通过查看数据汇总来了解数据,例如 NewConfirmed、TotalConfirmed 等数字列的计数、均值、标准偏差、分位数以及国家代码等分类列的频率、最高出现值。
countries_df.describe()
使用 describe 函数,我们可以得到数据集连续变量的摘要,如下所示: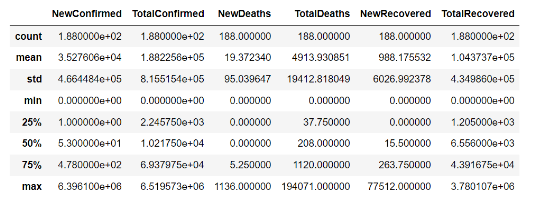
在 describe() 函数中,我们可以设置参数"include = 'all'"来获取连续变量和分类变量的摘要
countries_df.describe(include = 'all')
3、数据选择和过滤
分析其实不需要数据集的所有行和列,只需要选择感兴趣的列并根据问题过滤一些行。
例如,我们可以使用以下代码选择 Country 和 NewConfirmed 列:
countries_df[['Country','NewConfirmed']]
我们还可以将数据过滤Country,使用 loc,我们可以根据一些值过滤列,如下所示:
countries_df.loc[countries_df['Country'] == 'United States of America']
4、聚合
计数、总和、均值等数据聚合,是数据分析最常执行的任务之一。
我们可以使用聚合找到各国的 NewConfimed 病例总数。使用 groupby 和 agg 函数执行聚合。
countries_df.groupby(['Country']).agg({'NewConfirmed':'sum'})
5、Join
使用 Join 操作将 2 个数据集组合成一个数据集。
例如:一个数据集可能包含不同国家/地区的 Covid-19 病例数,另一个数据集可能包含不同国家/地区的纬度和经度信息。
现在我们需要结合这两个信息,那么我们可以执行如下所示的连接操作
countries_lat_lon = pd.read_excel('C:/Users/anmol/Desktop/Courses/Python for Data Science/Code/countries_lat_lon.xlsx')
# joining the 2 dataframe : countries_df and countries_lat_lon
# syntax : pd.merge(left_df, right_df, on = 'on_column', how = 'type_of_join')
joined_df = pd.merge(countries_df, countries_lat_lon, on = 'CountryCode', how = 'inner')
joined_df
6、内建函数
了解数学内建函数,如 min()、max()、mean()、sum() 等,对于执行不同的分析非常有帮助。
我们可以通过调用它们直接在数据帧上应用这些函数,这些函数可以在列上或在聚合函数中独立使用,如下所示:
# finding sum of NewConfirmed cases of all the countries
countries_df['NewConfirmed'].sum()
# Output : 6,631,899
# finding the sum of NewConfirmed cases across different countries
countries_df.groupby(['Country']).agg({'NewConfirmed':'sum'})
# Output
# NewConfirmed
#Country
#Afghanistan 75
#Albania 168
#Algeria 247
#Andorra 0
#Angola 53
7、用户自定义函数
我们自己编写的函数是用户自定义函数。我们可以在需要时通过调用该函数来执行这些函数中的代码。例如,我们可以创建一个函数来添加 2 个数字,如下所示:
# User defined function is created using 'def' keyword, followed by function definition - 'addition()'
# and 2 arguments num1 and num2
def addition(num1, num2):
return num1+num2
# calling the function using function name and providing the arguments
print(addition(1,2))
#output : 3
8、Pivot
Pivot 是将一列行内的唯一值转换为多个新列,这是很棒的数据处理技术。
在 Covid-19 数据集上使用 pivot_table() 函数,我们可以将国家名称转换为单独的新列:
# using pivot_table to convert values within the Country column into individual columns and
# filling the values corresponding to these columns with numeric variable - NewConfimed
pivot_df = pd.pivot_table(countries_df, columns = 'Country', values = 'NewConfirmed')
pivot_df
9、遍历数据框
很多时候需要遍历数据框的索引和行,我们可以使用 iterrows 函数遍历数据框:
# iterating over the index and row of a dataframe using iterrows() function
for index, row in countries_df.iterrows():
print('Index is ' + str(index))
print('Country is '+ str(row['Country']))
# Output :
# Index is 0
# Country is Afghanistan
# Index is 1
# Country is Albania
# .......
10、字符串操作
很多时候我们处理数据集中的字符串列,在这种情况下,了解一些基本的字符串操作很重要。
例如如何将字符串转换为大写、小写以及如何找到字符串的长度。
# country column to upper case
countries_df['Country_upper'] = countries_df['Country'].str.upper()
# country column to lower case
countries_df['CountryCode_lower']=countries_df['CountryCode'].str.lower()
# finding length of characters in the country column
countries_df['len'] = countries_df['Country'].str.len()
countries_df.head()